The British and Irish Chapter of the International Society of Magnetic Resonance in Medicine (BIC-ISMRM) hosts live online talks in collaboration with ISMRM Chapters across Europe. Each talk introduces a specific magnetic resonance topic, covering a wide range of specialities.
The sessions are usually held on Friday mornings (United Kingdom time), with time for questions from the viewers afterwards.
The BIC-ISMRM encourages wide participation, welcoming attendance from anyone involved with MR, not just members of the BIC or European Chapters.
Recordings of each talk are hosted here. Many past recordings are available through the same link, giving access to educational content from 2021 and 2022.
For even more educational content, visit the ISMRM ‘Online Education Program’.
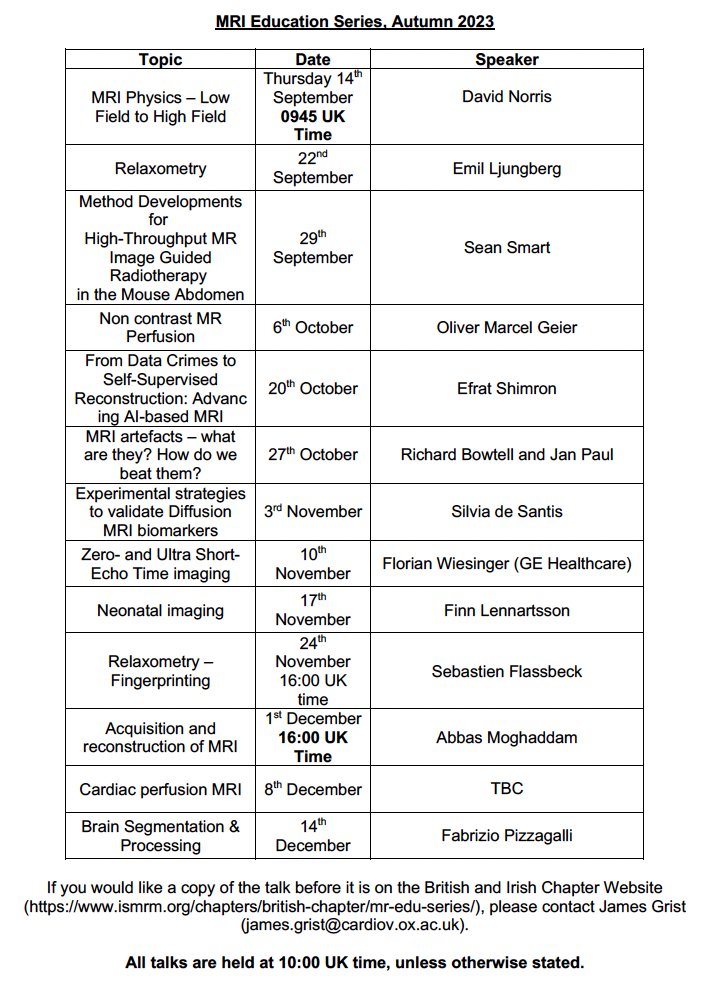
List of upcoming talks:
Sign up to the BIC mailing list to keep up-to-date with details of upcoming talks: https://www.jiscmail.ac.uk/cgi-bin/webadmin?A0=BCISMRM
The full list of talks for September 2023 to December 2023 (inclusive) is shown below.

Two talk titles from the list stand out as related to quantitative MRI:
- ‘Relaxometry – Fingerprinting’ by Sebastien Flassbeck (24th November 2023)
- ‘Relaxometry’ by Emil Ljungberg (22nd September 2023)
This post gives an overview of Emil Ljungberg’s talk on Relaxometry. It is a summary and not intended as a substitute for watching the full talk online and absorbing the content directly.
Relaxometry talk by Dr. Emil Ljungberg (Lund University)
On Friday 22nd September 2023, Dr. Emil Ljungberg gave an engaging and interesting online presentation on ‘Relaxometry’. Emil is a Magnetic Resonance (MR) researcher at Lund University (Sweden), with experience in quantitative MR and Zero Echo Time (ZTE) pulse sequences.
Aspects of the talk included:
- an introduction to relaxometry
- the physical basis of relaxometry
- the Bloch equations
- T1 and T2 in simple systems
- considerations for in vivo relaxometry
- the effect of B0 field strength
The meaning of T1 and T2
The lecture’s key message was that T1 and T2 are not inherent properties or features of tissues, rather they are a response to the Radio Frequency (RF) pulses used in MR pulse sequences.
Bloembergen-Purcell-Pound (BPP) theory was discussed, which demonstrates the effect of two factors on T1 and T2:
- Brownian motion of spins
- microscopic variations in the local magnetic field
Processes in the material affect both T1 and T2, as the two parameters are coupled.
The molecular motion correlation time model [Gupta2021] is not appropriate for understanding relaxometry in vivo. This point was emphasised with respect to a review paper on the fundamental explanations of T1 and T2 [Gupta2021], titled:
“Is it time to forgo the use of the terms ‘spin-lattice’ and ‘spin-spin’ relaxation in NMR and MRI?”
Relaxometry
T1 and T2 measurements are:
- sensitive to changes/variations
- unspecific
- difficult to measure well
- affected by confounding factors
Brain images were used to provide examples of T1 and T2 mapping, highlighting the difference between qualitative and quantitative images.
Solving the inverse problem to map myelin in the brain
There is a review paper on inverse problems for MRI [Spencer2020].
One application of T2-mapping is mapping myelin content across the brain to investigate conditions such as multiple sclerosis, a disease which involves myelin degradation.
Myelin forms a lipid layer around nerve cell axons, facilitating signal transmission along the axons. Medical imaging research aims to connect tissue microstructure with relaxometry parameter maps.
To map myelin across the brain, the following steps are performed:
- Perform a T2-mapping experiment to fit a T2 signal decay curve to each image voxel.
- The signal in each voxel is the weighted average of multiple signal decays, which correspond to different water compartments.
- Solve the inversion problem to derive the distributions of T2 values contained in each voxel.
- Water bound in the myelin bilayer has a shorter T2 than “free” water.
- Apply a biophysical model with assumptions about the tissue.
- In this context, the short T2 values represent myelin.
- Map the myelin-water fraction map using a biophysical model.
- Myelin-water fraction is the ratio of these two values:
- the integral of the short T2 distribution.
- the integral of the longer T2 distribution.
- Myelin-water fraction is the ratio of these two values:
Confounding factors in myelin T2-mapping can include:
- T1
- Magnetisation Transfer (MT)
- diffusion
- perfusion
- magnetic susceptibility
Variability of T1-mapping across different pulse sequences
Different T1-mapping methods give different results [Stikov2015], as they perturb the system differently. This causes the return to equilibrium (i.e. longitudinal relaxation) to be different.
Examples of sources of T1 measurement variations may include:
- incomplete signal spoiling.
- B1+ variations.
- MT effects depend on the choice of radio frequency pulses.
We try to minimise these effects or model all the effects but this may be difficult due to time limits.
Magnetisation Transfer
A harmonisation approach [Teixeira2020] to improve T1 map agreement between multivendor T1 and T2 mapping used a consistent radio frequency spoiling method and controlled saturation with a custom radio frequency pulse.
T1 and T2 versus field strength
Rooney2007 paper: T1 mapping at varying field strength. Gradient reduction in T1 for reduced B0:
Rooney WD, Johnson G, Li X, et al. Magnetic field and tissue dependencies of human brain longitudinal 1H2O relaxation in vivo. Magn Reson Med. 2007;57(2):308-318. doi:10.1002/mrm.21122
Talk contained interesting plot of T1 and T2 for BPP simulation of water, using simulation values from https://en.wikipedia.org/wiki/Relaxation_(NMR).
For CSF there is no change in T1 for B0 change, but is for WM (see screenshot from Gupta2021).
Wang Y, van Gelderen P, de Zwart JA, Duyn JH. B0-field dependence of MRI T1 relaxation in human brain. Neuroimage. 2020;213:116700. doi:10.1016/j.neuroimage.2020.116700
Bound pool affects T1 change for B0 change.
Inline with the BPP theory (spins in semi-solid environment show more of a T1 change for B0 change than those in liquid).
bound pool T1 derived versus B0.
Key point: there is a field strength dependency of T1 but is isn’t as straight forward as saying “T1 is shorter at low field”.
Colourmaps for parameter maps
The talk touched on colourmaps, which is an often overlooked issue.
Colourmaps are used in image processing to assign colours to each value of an image.
Colourmaps and images can be deceptive.
The greyscale colourmap is easy to understand.
The Jet colour scheme is difficult for our eyes to understand. The clarity is dependent on the chosen lower and upper ranges.
It is recommended to use perceptually uniform colormaps, such as gray, inferno, viridis.
A comparison of colour maps is available on the matlab website.
Talk Summary
- T1 and T2 are time constants, not tissue features
- the BPP model is suitable for simple systems but not in vivo
- in vivo relaxometry
- the effect of field strength.
Final slide: Relaxometry summary:
- relates to the dynamics of the magnetisation vector
- a fundamental process for qualitative and qMRI
- relates to tissue features is difficult
- reproducible measurements can be challenging
- requires an understanding of the pulse sequence and post-acquisition image analysis
- a rich field of research with plenty more research topics to explore
Emil invited the audience to reach out via email or LinkedIn.
Q&A session
- are phantoms with known T1 and T2 OK for low field strengths?
- the ISMRM/NIST phantom T1 didn’t change as you would see in vivo
- phantoms often don’t capture everything you see in vivo, such as effects from magnetisation transfer and temperature
- Emil has been using a CaliberMRI phantom at low field
- what is the effect of changing the voxel size?
- Signal-Noise-Ratio changes
- gradient change, which could affect spoiling
- may inadvertently lead to shorter TR, which could increase the MT effect
- partial volume effect changes
- Point Spread Function (PSF) changes
- low-field systems can be limited by low SNR
- low-field sequences can take advantage of short T1
References and further reading
- Gupta A, Stait-Gardner TJ, Price WS. Is it time to forgo the use of the terms ‘spin-lattice’ and ‘spin-spin’ relaxation in NMR and MRI? Journal of Physical Chemistry Letters. 2021:6305-6312. doi:10.1021/acs.jpclett.1c00945
- Spencer RG, Bi C. A Tutorial Introduction to Inverse Problems in Magnetic Resonance. NMR in Biomedicine. 2020;33(12):e4315. doi:10.1002/nbm.4315
- Stikov N, Boudreau M, Levesque IR, Tardif CL, Barral JK, Pike GB. On the accuracy of T 1 mapping: Searching for common ground: Accuracy of T 1 Mapping. Magn Reson Med. 2015;73(2):514-522. doi:10.1002/mrm.25135
- A. G. Teixeira RP, Neji R, Wood TC, Baburamani AA, Malik SJ, Hajnal JV. Controlled saturation magnetization transfer for reproducible multivendor variable flip angle T1 and T2 mapping. Magnetic Resonance in Medicine. 2020;84(1):221-236. doi:10.1002/mrm.28109