The International Society of Magnetic Resonance in Medicine (ISMRM) has a British and Irish Chapter (BIC-ISMRM). In September 2023, the BIC-ISMRM had its annual conference in Aberdeen.

Abstracts and full programme:
https://www.abdn.ac.uk/events/documents/BIC-ISMRM%20Abstract%20booklet%20FINAL%20compressed.pdf
The main meeting was held over two days (14th-15th September), with a low-field workshop on 13th September. Online attendance was available, allowing access to the abstracts and the talks of the main conference. This post is a reflection from the perspective of an online attendee.
Topics related to quantitative MRI included:
- High-field T1, T2 & T2* (e.g. 14T B0 strength)
- T1
- T1 dispersion (i.e. T1 versus magnetic field) using Fast Field Cycling (FFC)
- T1𝜌
- T2
- T2 and the Magic Angle Effect
- Magnetic Resonance Fingerprinting (MRF)
- Tissue conductivity mapping
- Quantitative Susceptibility Mapping (QSM)
- Zero Echo Time (ZTE)
- Commercial phantoms
High-field T1, T2 & T2*
David Norris (Radboud University, NL).
The main conference began with David Norris (Radboud University, NL) speaking on the:
“Benefits and Challenges in moving to 14T MRI”.
David is leading a Dutch research consortium to develop a 14T scanner for human imaging, estimating that their system could be ready for imaging human volunteers in approximately 5 years.
Project press release: https://www.ru.nl/en/research/research-news/strongest-mri-scanner-in-the-world-will-be-built-in-the-netherlands
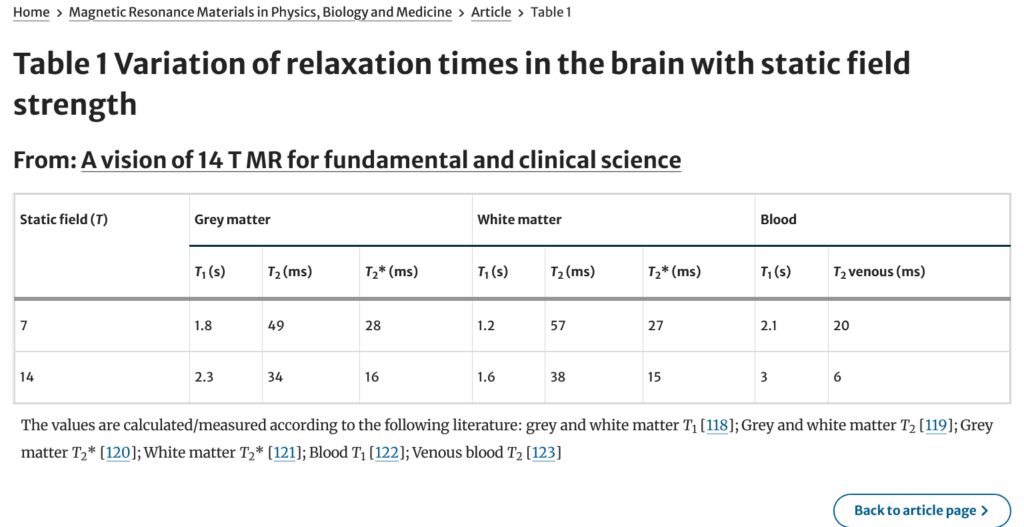
The talk contained examples of brain tissue relaxation parameters for 7T versus 14T, giving an insight into how T1, T2, and T2* differs between these two conditions. A table of these relaxation times is provided in Bates2023, with T2 and T2* increasing with field strength and T1 shortening:

Other research presentations during the conference included topics related to quantitative MRI. Some measured parameters directly, while others presented broader areas of MRI which could be connected to quantitative imaging. Here is some brief notes on a selection of those talks, grouped in terms of MR parameters and topics.
T1
Meshal Alzahrani (University of Leeds, UK) et al.
“Do anthropomorphic phantoms enhance compliance with the professional bodies’ quality
assurance guidelines for MRI in radiotherapy?”.
T1 relaxation times were calculated for each phantom to determine the appropriate repetition time (TR) to use with each of them.
T1 dispersion
T1 dispersion featured in many of the talks over the conference, with numerous examples from researchers at the University of Aberdeen.
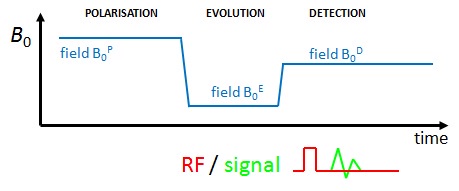
T1 depends on the magnetic field strength B0. A T1 dispersion profile can be plotted by making multiple T1 measurements across a range of B0 strengths, acheived using Fast Field Cycling (FFC). This adds greater dimensionality to T1 assessments and potentially allows increased sensitivity to subtle T1 differences between tissues.
FFC operates in three stages: polarisation, evolution, and detection. T1 dispersion is plotted by adjusting the magnetic field strength during the”evolution” phase (B0E) of the pulse sequence and making a T1 measurement for each of these B0E values, as portrayed by the figure below:

Researchers at the Aberdeen Biomedical Imaging Centre (ABIC) have developed low-field equipment to perform FFC relaxometry.
James Ross (University of Aberdeen, UK) et al.
“Progress towards cardiac T1 dispersion imaging using field-cycling imaging”.
T1 dispersion in cardiac using fast field cycling, taking T1 over a spectrum of B0 to acquire a unique signature. Aiming to detect ischaemia or fibrosis, without needed to inject a contrast agent.
T1 errors can occur due to breathing and partial volumes. There is room for improvement in imaging resolution and fitting.
Acquisition duration per image is approximately 2-4 minutes. Total duration is 45 minutes. Field cycle for every k-space line. Scanning would be faster using a “snapshot” acquisition.
Amnah Alamri (University of Aberdeen, UK).
“In-vivo and ex-vivo detection of Colorectal Cancer at ultra-low field using Fast Field-
Cycling methods”.
Looking for any features of the T1 dispersion profile that help us detect disease.
Vasiliki Mallikourti (University of Aberdeen, UK).
“Breast cancer imaging at low and ultra-low magnetic fields using Field Cycling Imaging: a
clinical pilot study”.
Katie Hanna (University of Aberdeen, UK).
“Fast Field Cycling Nuclear Magnetic Resonance: A Novel Tool for the Detection and
Characterisation of Breast Cancer”.
Fast field cycling for detecting and characterising breast cancer.
Hana Lahrech (University of Aberdeen, UK; University Grenoble Alpes, FR).
“Transmembrane water exchange in cellular metabolism and its role on T1 relaxation at low field:
towards an invasion/migration theranostic imaging”.
T1𝜌
Liene Balode (University of Aberdeen, UK).
“T1𝜌 imaging for detecting takotsubo cardiomyopathy”.
Takotsubo cardiomyopathy is otherwise known as “broken heart” syndrome and can occur after intense emotional or physical stress.
T1𝜌 is spin-lattice relaxation in the rotating frame of reference. The sequence is repeated with varying spin lock pulse duration.
To measure T1𝜌, the pulse sequence timing is adjusted, with signal measurements made for various lengths of Spin Lock Time (TSL). This work used 6 TSL values to measure T1𝜌, claiming no difference for 4 points. A viewer made the point that it would be useful to have ‘goodness of fit’ maps.
A 3-parameter fit is better than 2, as it accounts for the “ground level”. This seems similar to T2 fitting using a “signal offset” term.
T1 and T2*
Elizabeth Shumbayawonda (Perspectum Ltd, UK).
“Liver Magnetic Resonance Imaging, Non-Alcoholic Fatty Liver Disease and Metabolic Syndrome Risk in Pre-Pubertal Mexican Boys”.
Perspectum correct their liver T1 measurements (cT1) for the influence of iron, which would otherwise lead to overestimates. A T2* map is used for this correction, since tissues with high iron content usually have reduced T2*.
T2 and the magic angle effect
Karyn Chappell (Imperial College London, UK).
“MADI: Harnessing the Magic of the Magic Angle Effect”.
The Magic Angle (MA) effect is more pronounced in low TE sequences.
Cannot remove the MA effect – it will be present in any sequence with T2 decay term.A question for interpreting an image feature: is it pathology or a magic angle artefact?
Orientation of collagen in knee imaging.
The knee joint has a majority of short T2 tissues.
T2 increases at the MA.
MA is related to dipole moments and dipole-dipole interactions (mriquestions.com/magic-angle.html)
Magic Angle Directional Imaging (MADI) performed by scanning scanned goat legs.
A 0.15T scanner, using permanent magnets.
Magnetic Resonance Fingerprinting (MRF)
Gabriel Zihlmann (University of Aberdeen, UK; University of Basel, CH).
“A High-Performance Clustered Dictionary Search Engine using GPUs”.
Using Graphics Processing Units (GPUs) to perform MRF dictionary searching.
Brute force dictionary matching is slow and mathematically accurate, but not necessarily physically accurate.
Alternatives include: dictionary compression or clustered dictionary searches.
Dictionary entries may be clustered with similar entries, using a particular comparison metric. For example, entries with similar means may be grouped, creating a new entry to represent each cluster.
Group matching is described in this paper:
Cauley SF, Setsompop K, Ma D, et al. Fast group matching for MR fingerprinting reconstruction. Magn Reson Med. 2015;74(2):523-528. doi:10.1002/mrm.25439
The work in this presentation expanded a software library to use complex values.
Bill Moore lecture by Fiona Gilbert (University of Cambridge, UK)
“Standing on the shoulders of Giants – clinical application of the developments in MR”.
Aspects of imaging included sensitivity and specificity.
There is a need for better value for money and to show that the imaging is having an impact on the patient and getting improved outcomes.
Value = benefit / cost.
“Abbreviated” MRI – can we get the same benefit with a reduced scan duration?
Colleagues at the University of Cambridge are working on MRF.
Desired qualities for future MRI: rapid, cheaper, quieter, functional data, greener.
A rallying call to end: “everything is possible!”
Conductivity mapping
Oriana Arsenov (University College London, UK)
“Rapid In-Vivo Quantitative Conductivity Mapping in the Human Brain Using a Multi-Echo EPI Sequence”.
Echo Planar Imaging (EPI) artefacts seen in phase images. 3D EPI may not have the artefact.
Gradient Recalled Echo (GRE) is used as a reference to evaluate the EPI corrections in this work.
it is difficult to have a real phantom for conductivity mapping.
Quantitative Susceptibility Mapping (QSM)
Francesco Digeronimo (Trinity College Dublin, IE)
“Exploring the Potential of Quantitative Susceptibility Mapping (QSM) to Predict Plaque
Rupture Risk: Ex Vivo Human Carotid Atherosclerotic Plaque QSM Pipeline Optimisation”.
An application of QSM to assess plaque vulnerability.
Zero Echo Time (ZTE)
General Electric (GE), represented by Tobias Wood (King’s College London, UK).
Collaboration with General Electric (GE). Zero Echo Time (ZTE) pulse sequences are much quieter than conventional pulse sequences and can be adapted for quantitative mapping.
Commercial phantoms
Gold Standard Phantoms, represented by Aaron Oliver-Taylor.
“Enabling qMRI”.
Routine quality assurance.
Acceptance testing and accreditation – testing the equipment and the staff.
Aiming to “harmonise” over multiple sites.
MRI systems property distributions (B1 and B0) change depending on what is scanned. This can be contrast with measurements of mass using scales, which do not change when they weigh something.
The company will be getting a 0.3T benchtop scanner to do their own evaluation.
